GibbsStudio 6.1
Hello, GibbsStudio Community!
This is the largest release since 6.0, and it took rather longer than the “coming weeks” we promised in January. Every library, every plugin and the application itself went through a review, the manual was rewritten around what GibbsStudio actually does, and macOS is back.
macOS, on the 6 line
GibbsStudio 6.1 runs on Apple silicon, macOS 14.4 or later, as a self-contained application bundle. Download the disk image, drag GibbsStudio into Applications, done.
Two things to know before you do, because we would rather you heard them from us.
macOS will refuse to open it the first time. The build is not signed with an Apple Developer ID. You allow it once — try to open it, dismiss the warning, then go to System Settings › Privacy & Security and press Open Anyway on the line about GibbsStudio — and it opens normally from then on. The installation chapter has the steps with screenshots, including what changed in macOS 15.
Updates on macOS are not automatic. GibbsStudio tells you when a new release is out and offers to open the download page; you fetch the new disk image and drag it over the old copy. Your projects, your licences and your settings live outside the application and survive the replacement. On Windows nothing changes: updates still install from inside the application.
A Linux version is still intended rather than scheduled. If you want one, say so — we are counting.
Water Chemistry
The Akva module grew from “import samples and draw three diagrams” into a proper analysis of a set of water analyses.
It starts where a hydrochemist starts: with whether the numbers can be trusted at all. Give it a table of major-ion measurements and it computes the charge balance error for each sample against a tolerance you set. A sample that fails stays in the table but can be kept out of the aggregates and the diagrams. In our experience a large imbalance almost never means a bad measurement; it means an ion the water contains that the analysis has no column for, and it is worth finding out which one before you model anything.
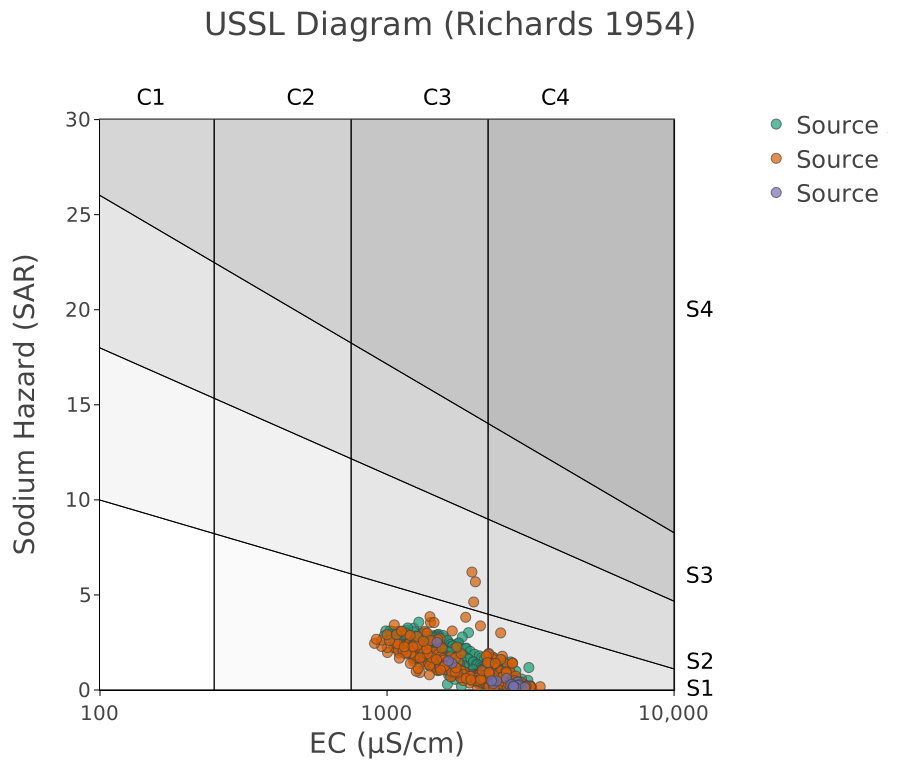
From the same meq/l values it names each water by its dominant cation and anion and by its Piper facies, and computes the irrigation indices — SAR, Na %, RSC, the Kelly ratio, magnesium hazard, permeability index, hardness, and with conductivity the USSL class. Samples can be aggregated by point or by category: earliest, latest, minimum, maximum, mean or median, with each aggregate reporting how many samples it came from. A median of two is not a median, and now you can see that it was two.
Columns are matched by name, not by position, so your laboratory’s export order does
not matter and extra columns are ignored. An empty or non-numeric cell (<0.1, n.d.)
is reported as missing rather than quietly read as zero.
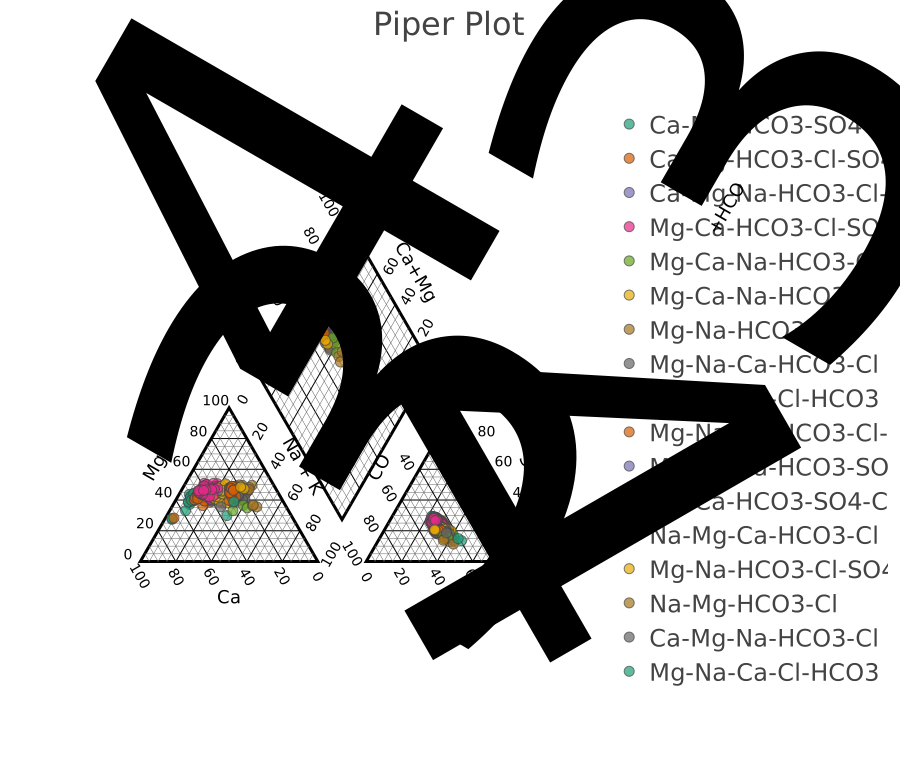
The three diagrams — Piper, Schoeller, USSL — are each a quick result now, which builds the plot and the analysis behind it in one step instead of making you assemble them. The Piper at the top of this page is one of them; here is the USSL, which answers the irrigation question on its own.
Comparing databases
The database decides the answer as much as the input does. Two colleagues modelling the same water with the same keywords and different databases will get different numbers, both correct for what they were asked, and the argument that follows usually takes a week.
A database comparison study takes several databases and a system you name — written
as the elements involved, say Ca, C, Fe(3) — and reports what each database has and
lacks for that system, the species and phases per element and valence state, where each
one is defined, how far apart the log K values are where the reaction is written the
same way, and log K against temperature.
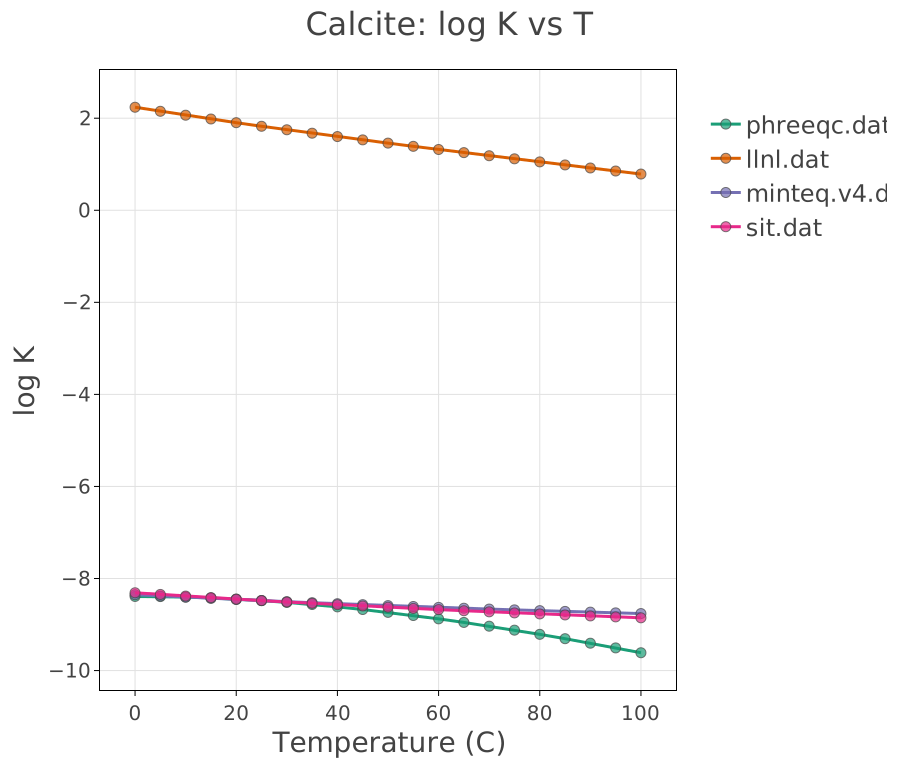
That is calcite in four databases. The example behind it, Calcite and Quartz in Four Databases, walks through the three different ways they manage to disagree about two very ordinary minerals.
One caveat is built into the definition: where the reaction is written alike. The same equilibrium written with a different reaction has a different constant, and those two numbers are not comparable. The comparison says which pairs it could line up.
A Monte Carlo run you can repeat
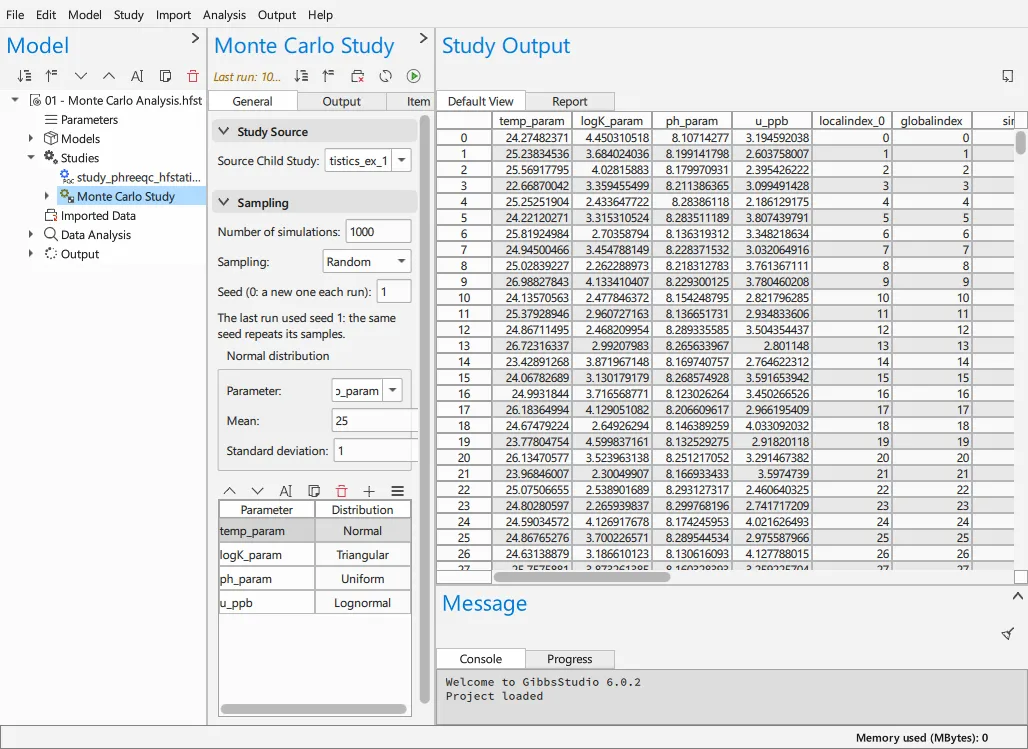
Monte Carlo studies now carry a seed. The same seed draws the same samples, so the figure in your paper can be reproduced — by a reviewer, by a colleague, by you in two years when you no longer remember what you did. Set it to 0 if you want a fresh draw every run. Each distribution has its own stream, so adding a parameter does not reshuffle the ones already there.
Sampling can be Latin hypercube as well as random: each distribution is cut into equally probable strata with one draw in each, which covers the input space with far fewer simulations than independent draws need. Three distributions joined the set — log10-normal, truncated normal and log-uniform — alongside normal, lognormal, uniform and triangular.
Fitting
Parameter fitting gained the controls that separate a fit you can defend from one you cannot. A parameter can be held fixed while the others move, or searched on a log scale, which is what you want for a rate constant that spans orders of magnitude. Residuals of different reliability can be weighted by their standard deviation. Observed values are declared rather than reconstructed, and the fitted value is available as a value you can use in an expression downstream instead of copying it out by hand.
Ceres’ own diagnostics now reach the study’s report, and a failed check fails the fit rather than passing quietly — which, we admit, is how it should always have behaved.
The application itself
A lot of small things, most of which you will notice only by not being annoyed:
- Light, dark or follow the system, in Application Settings.
- A Help menu at last, with the manual, the release notes and the update check in it.
- Tables edit in place. Click or F2 to edit; Enter, Escape, Tab and Shift+Tab move between editable cells; Ctrl-click and Shift-click select the way they do everywhere else.
- The header says when results are out of date and how the last run went, and the Welcome page lists your recent projects.
- Drop a PHREEQC input on the window. It opens as a new project with its selected output already in a lab.
- Examples open as a copy in your documents, so the shipped original is never edited by accident.
- Every data table has an export button. Every single one. This took embarrassingly long.
The example browser was rebuilt around a reasonable question: what does this example draw? Each one is now a card carrying the figure its documentation opens with, grouped by set and searchable across all of them, with Open beside the page instead of three columns away.
And projects open in about a second rather than several. Forms and plots are built when they are first shown rather than all at once, which is the kind of change nobody writes home about and everybody feels.
The manual
Rewritten, not revised. New chapters on the project model, water chemistry, parameter fitting, predominance diagrams, PHREEQC databases, importing and exporting, and a short getting-started for people who have just installed it and want something on screen.
The examples are now a chapter of the manual rather than a separate site, which means one place to search and one set of links that stay alive. Read it here.
Fixes worth naming
A project that uses a plugin you do not have now opens — without that plugin’s parts, and saying so in the Console, instead of refusing. Plugin dependencies are declared and honoured.
A sweep’s results come back in simulation order, the same at every run. Project dates are stored in UTC, so a project no longer changes when it crosses a time zone. Deleting a parameter row no longer closes the application. Invalid values are red again, including in dark mode. Opening a project saved by an older version no longer fills the Console with internal notes about reading it; the reading was always fine, the commentary was not.
The full list is in the release notes, which Help › Release Notes opens.
Getting it
6.1 is on the download page for Windows 10 or later (x64) and macOS 14.4 or later on Apple silicon. Same installer for Community and Professional; a licence file activates the Pro modules from Help › Plugins….
On Windows, Help › Check for Updates… will offer it to you.
Built against PHREEQC 3.8.8 and Qt 6.12.
As always: tell us what breaks. It is the only way we find out.