Pr · Pro module
Predominance
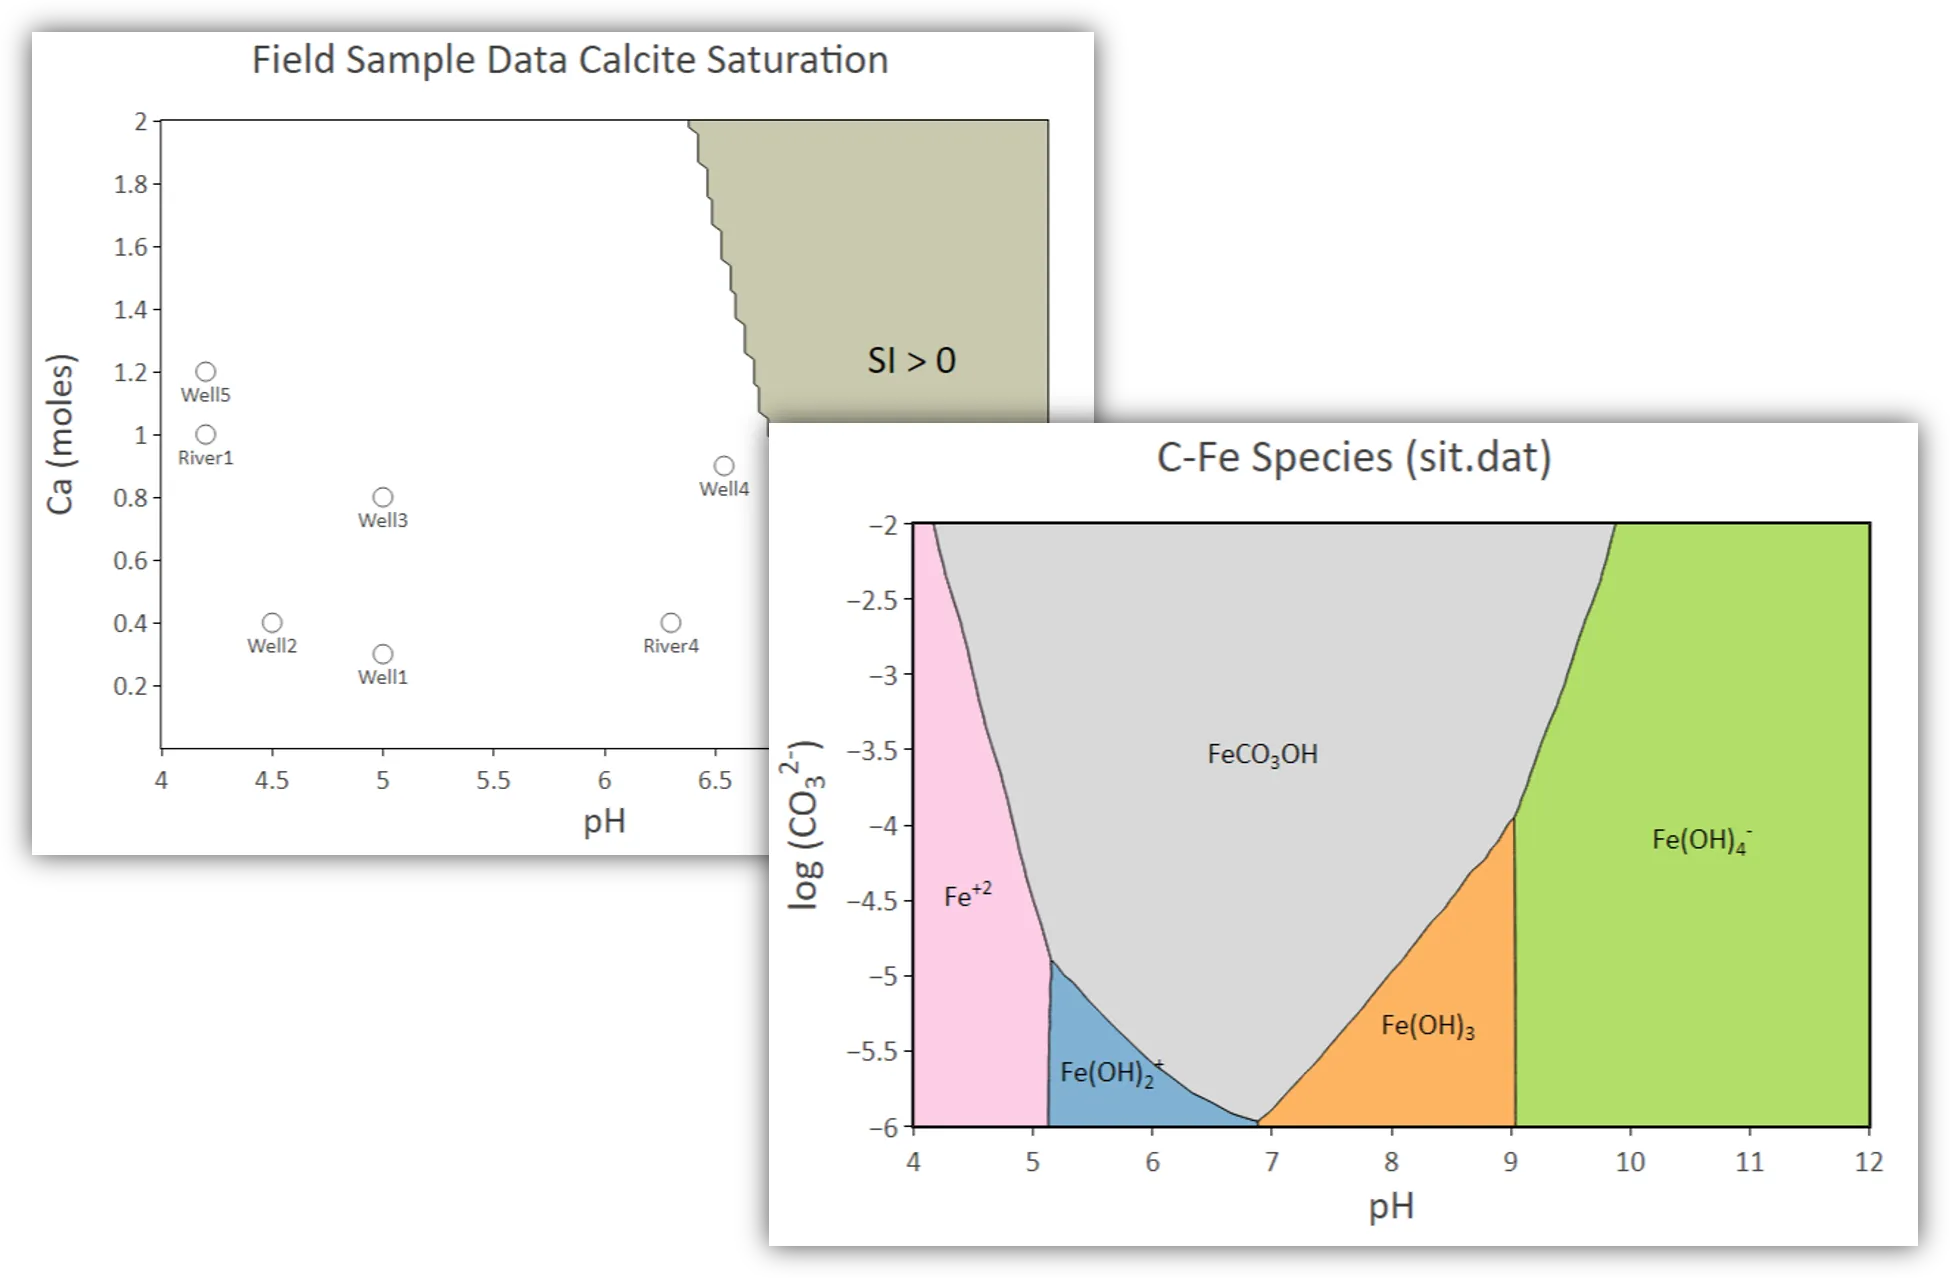
Compute predominance boundaries directly from PHREEQC and draw them as Pourbaix and stability diagrams.
Included in GibbsStudio Professional and Enterprise.
What Predominance does
- Track boundaries, not the whole field
- A predominance study follows the lines where one expression gives way to another instead of evaluating everything either side of them, so a sharp diagram costs a fraction of the simulations a lattice of the same sharpness would need.
- Any two axes
- Classically pe against pH — an Eh–pH or Pourbaix diagram — but the axes can be anything the model depends on: temperature, a total concentration, a partial pressure.
- Second and third rank
- Each expression is reported at a level: predominant, sub-predominant, sub-sub-predominant. A species that never dominates anywhere can still be the interesting one.
- Masks, labels and your samples
- Constraint areas restrict the diagram to where it means something — the water stability limits are the usual case — labels name the fields, and scatter traces put your field samples on top.
Typical uses
- Eh–pH diagrams for redox-sensitive elements
- Mineral stability fields over pH and activity
- Comparing predominance between thermodynamic databases
Other modules
01CommunityAkvaIon balance, water types, irrigation indices and the three diagrams02CommunityPhreeqcInputs, databases, selected output and parametric runs04ProStatisticsMonte Carlo uncertainty, reproducible sampling and PCA05ProOptimizationFit kinetics, isotherms and titrations to lab data06ProDatabaseLook inside a thermodynamic database, and compare several
Bring your existing PHREEQC models
Inputs and databases import as they are. PHREEQC is bundled, so you can start in minutes.